Elasticsearch install
# zip file download
wget https://artifacts.elastic.co/downloads/elasticsearch/elasticsearch-5.6.5.tar.gz

# zip
tar -xvf elasticsearch-5.6.5.tar.gz

# port setting
vim config/elasticsearch.yml
# set the bind address to a specific IP (IPv4 or IPv6):
#network.host: 192.168.0.1
#network.host: 0.0.0.0
# set a custom port for HTTP:
#http.port: 9200
yml 문서로 들어가면 아마도 위와 같이 모두 주석처리가 되어있을것이다.

Elasticsearch를 나중에 kibana와 연결하기 위해서는 http.port를 50077, 잘 쓰지않는 port 번호로 열어준다.
port 번호 열 때는, 항상 조심하도록 한다. 만약 지정한 port 번호를 어느 프로세스에서 사용하고 있다면,
이는 conflict 나기에 최적의 조건이다. 주의할 것!!!

위에는 elasticsearch의 옵션이 나와있다. 나중에 참고하자
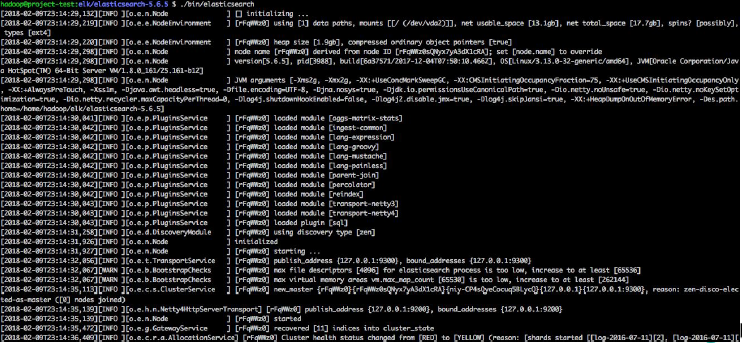
아마 Elasticsearch 실행하면 다음과 같은 화면이 출력되면서 실행되는 것을 알 수 있다.
만약 실행하고 있다면, 해당 terminal window는 쓰지 못하니, tmux를 활용하면 좋다.
2019/12/13 - [open source] - Open Source : tmux 사용하기
Open Source : tmux 사용하기
tmux ? 란 tmux는 terminal 창을 여러개로 분할, 나누어서 terminal 창을 좀 더 효율적으로 쓸 수 있다. 실제로 나는 elasticsearch를 활성화 시켜두고, kibana를 활성화 시켜두고, 나머지 terminal을 창 분할하여..
mambo-coding-note.tistory.com
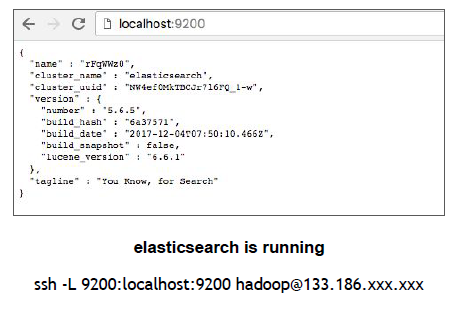
위의 그림처럼 localhost 에서 사용할거라면, 터널링은 따로 필요하지않다.
만약에 내가 elastic을 서버에서 돌리고 내 local에서 보고싶다면, 위와 같이 터널링을 해준다.
이 때 9200은 우리가 elastic config에서 config 해주었던 port 번호로 한다.
우리는 elasticsearch에 query를 입력하기 전에,
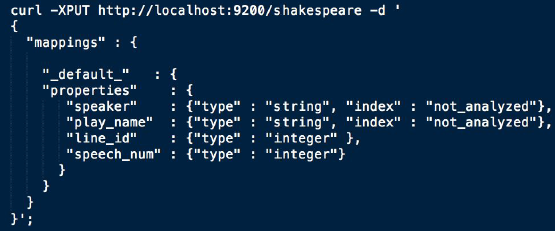
Mapping 할 구조를 미리 적어준 후 data를 입력해야한다.
# json 파일 입력
curl -XPOST http://localhost:{ }/shakespeare/_bulk\?pretty --data-binary @{ }.json

# 파일 input 후 indexing 되어있는지 확인
curl http://localhost:{ }/_cat/indices\?v

# query 입력
curl -XPOST http://localhost:50070/shakespeare/_search\?pretty -d '{
  "query": {
      "bool": {
          "must": [
      { "match": {  "line_number" : "1.1.14"  } },
      { "match": {  "speaker" : "KING HENRY IV" } }
      ]
    }
  }
}'

# output
{
  "took" : 4,
  "timed_out" : false,
  "_shards" : {
    "total" : 5,
    "successful" : 5,
    "skipped" : 0,
    "failed" : 0
  },
  "hits" : {
    "total" : 1,
    "max_score" : 13.52227,
    "hits" : [
      {
        "_index" : "shakespeare",
        "_type" : "line",
        "_id" : "16",
        "_score" : 13.52227,
        "_source" : {
          "line_id" : 17,
          "play_name" : "Henry IV",
          "speech_number" : 1,
          "line_number" : "1.1.14",
          "speaker" : "KING HENRY IV",
          "text_entry" : "Shall now, in mutual well-beseeming ranks,"
        }
      }
    ]
  }
}
실제로 query를 입력하면 output의 정보가 나오고
그 다음 실제 data의 output이 나온다.
query에 대한 정보, 어떻게 입력하는지는 밑에 주소에서 확인한다.
https://www.elastic.co/guide/en/elasticsearch/reference/current/query-filter-context.html
Query and filter context | Elasticsearch Reference [7.5] | Elastic
Use query clauses in query context for conditions which should affect the score of matching documents (i.e. how well does the document match), and use all other query clauses in filter context.
www.elastic.co
Elasticsearch를 terminal 환경에서 그냥 실행하려면 이렇게 진행하면 된다.
하지만 내가 좀 더 시각화해서 보고싶다. 하면 밑에 Kibana 설치, 실행을 진행한다.
Kibana
Configuration
# kibana download
wget https://artifacts.elastic.co/downloads/kibana/kibana-5.6.7-linux-x86_64.tar.gz

# 압축풀기
tar -xvf kibana-5.6.7-linux-x86_64.tar.gz

# config kibana
vim conf/kibana.yml
# The Kibana server's name. This is used for display purposes.
#server.name: "your-hostname" 난 50071
# The URL of the Elasticsearch instance to use for all your queries.
elasticsearch.url: "http://localhost:50070"
server.name은 kibana의 port 번호를 적어준다.
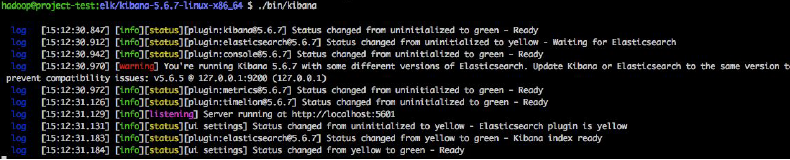
실제로 kibana 실행하면 이런 화면이 뜬다.
위에 config 파일에서 port 번호 입력했던 사이트(http://localhost:50071)로 들어가면 kibana가 실행된다.
index pattern
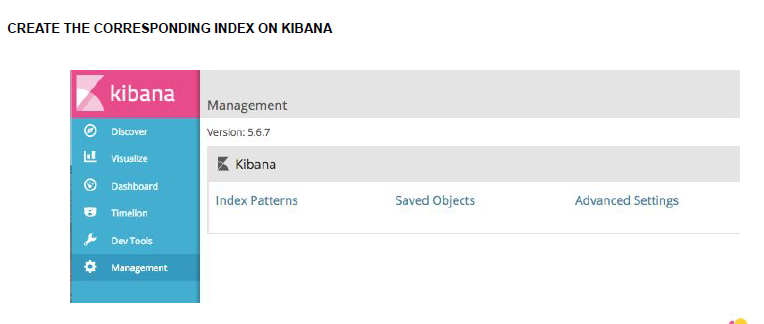
index patterns를 들어가면 project들 마다 index들의 pattern을 볼 수 있다.
index로 data 분석
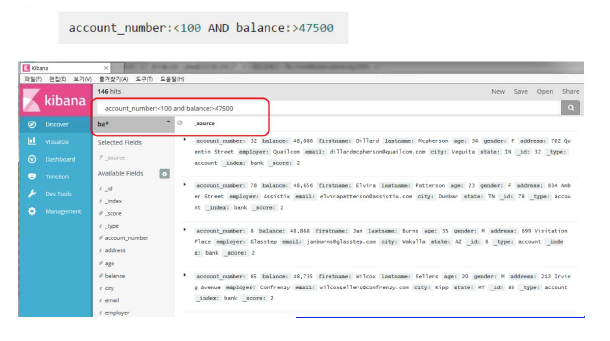
물론 log 파일말고도 다른 json 파일을 input하고 분석도 가능하지만, 그냥 sql에 넣어두고 진행하는 부분이 더 좋을 것 같다.
Log 분석
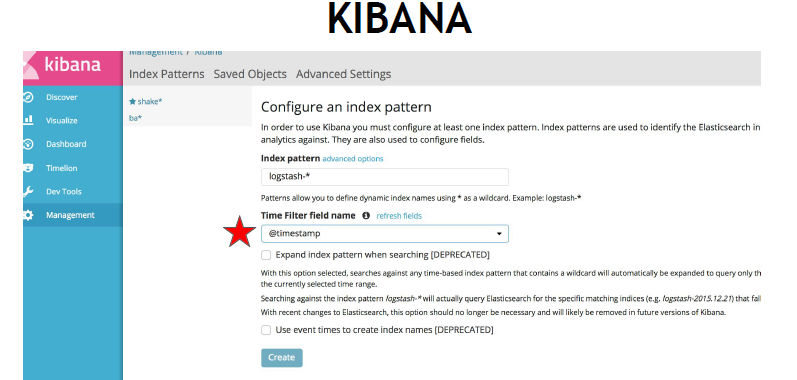
index patterns 을 적용할 파일들을 logstash-* 로 한 것은 logtash- 로 시작하는 파일들은 모두 이 pattern으로 적용한다는 의미다.
filter를 timestamp를 한다면, 이는 log들이 시간대별로 어떻게 log가 발생했는지 추적이 가능하다.
우리가 웹서버를 구축하고 있어, 어느 지역에서 어느 시간대에 접속했는지 궁금할 때는 이 방법을 쓰자.
물론 visualization 할 때, update가 현재시간으로 되어있으니, timestamp해서 시간대를 보고 싶은 경우, 시간대를 정하는 부분에서 그 시간대에 맞춰준다.
'대학원 공부 > computer science' 카테고리의 다른 글
| Network : Network Layer : Internet Protocol (0) | 2019.12.17 |
|---|---|
| Network : Application Layer (0) | 2019.12.16 |
| Open Source : Logstash & Elasticsearch & Kibana (0) | 2019.12.13 |
| Open Source : tmux 사용하기 (0) | 2019.12.13 |
| Network : Network Layer : Logical Addressing (0) | 2019.12.12 |


댓글